12 Important Digital Marketing Metrics You Shouldn’t Neglect

The whole point of putting time, effort, and cash into a digital marketing strategy is to drive results, right?
Well, if you want to boost ROI, you need to track the right digital marketing metrics.
Google Analytics is completely free but it’s loaded with important stats so you can piece together a comprehensive understanding of your website traffic and activity.
Analytics can get kind of (okay, very) confusing if you don’t know what you’re looking at. Don’t worry, it’s normal to feel overwhelmed. Let’s break down the basics…
12 Digital Marketing Metrics You Need to Track
Yes, 12 sounds like a lot of analytics to track but they each serve different purposes.
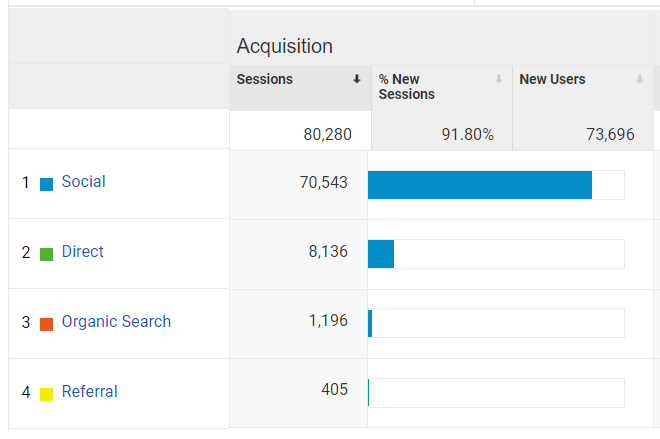
1. Acquisition Sources
Your Acquisition Sources tell you where your traffic comes from. Diversity is your friend here because you don’t want to rely on any sole source for all your traffic.
On the Overview screen, Google Analytics tells you in percentages where your traffic comes from, spread out over four channels.
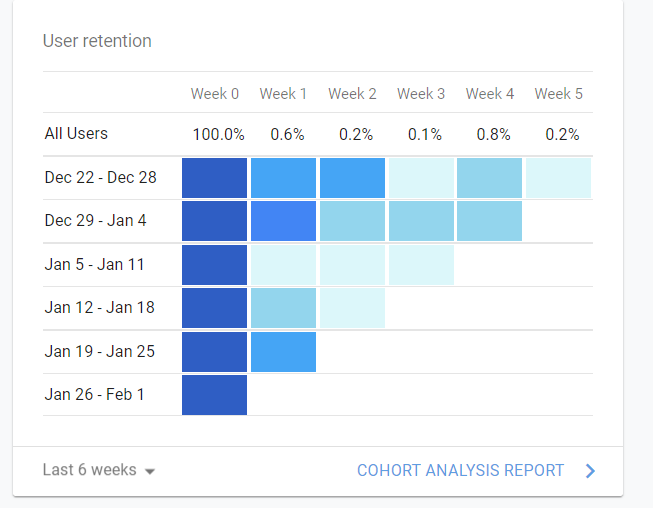
2. User Retention
On your home screen, you can see how you retain users as the month goes on. Your goal is to build a loyal audience so you’d like to see these percentages higher than those in the image below.
Viral pieces of content can throw off your retention rate if people don’t return the rest of the month.
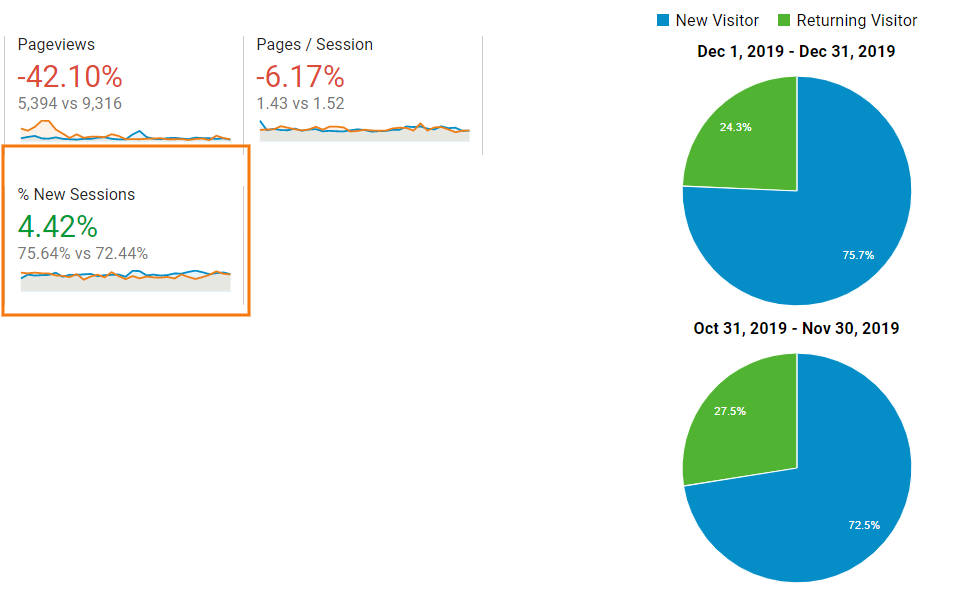
3. New Vs. Returning Users
You can find this state in the Audience Overview screen of Google Analytics. It tells you how many of your visitors are regulars. The higher, the better.
Returning visitors tend to have higher engagement, bounce less, view more pages each session, AND stay on your site for longer periods.
Not only that, but they also have higher conversion rates, higher sales, and higher customer lifetime values.
By looking at these digital marketing metrics month over month, we can see that over a quarter of this site’s visitors are regulars and their returning users grew by almost 4.5% over the 30-day period. Not bad!
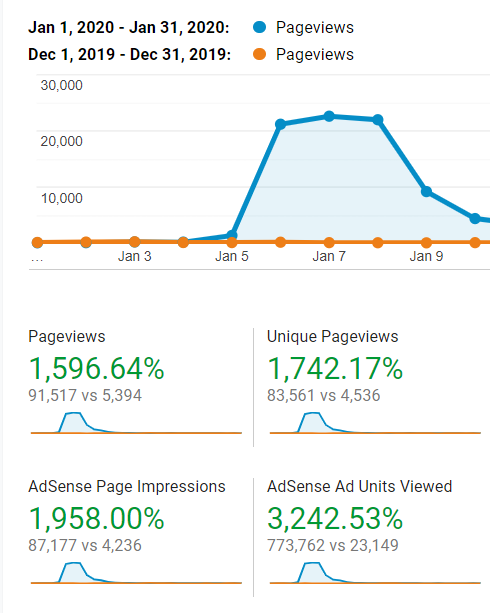
4. Pageviews
Google Analytics gives you two different Pageview digital marketing metrics under the Behavior tab. Pageviews tells you how many pages were viewed over a specific period and includes repeat views of the same page.
Unique Pageviews, however, tell you how many times someone visited each page at least once. If someone visits a page multiple times, you know they must really like the content.
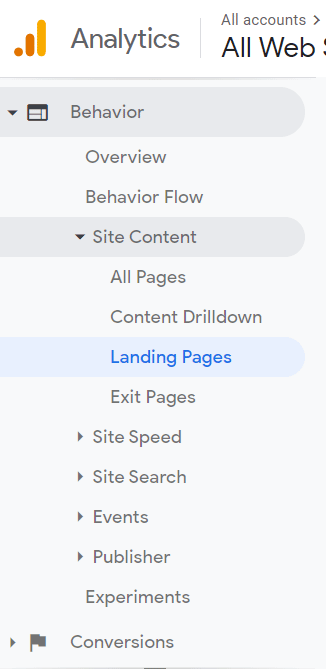
5. Top Landing Pages
Google Analytics gives you a special report specifically for landing pages. Keep in mind that what you and Google consider a landing page may be different. Google’s Landing Page figure is useful because it tells you the first point of contact with visitors.
THESE are the pages you’ll want to optimize right away – especially if you see patterns month-over-month.
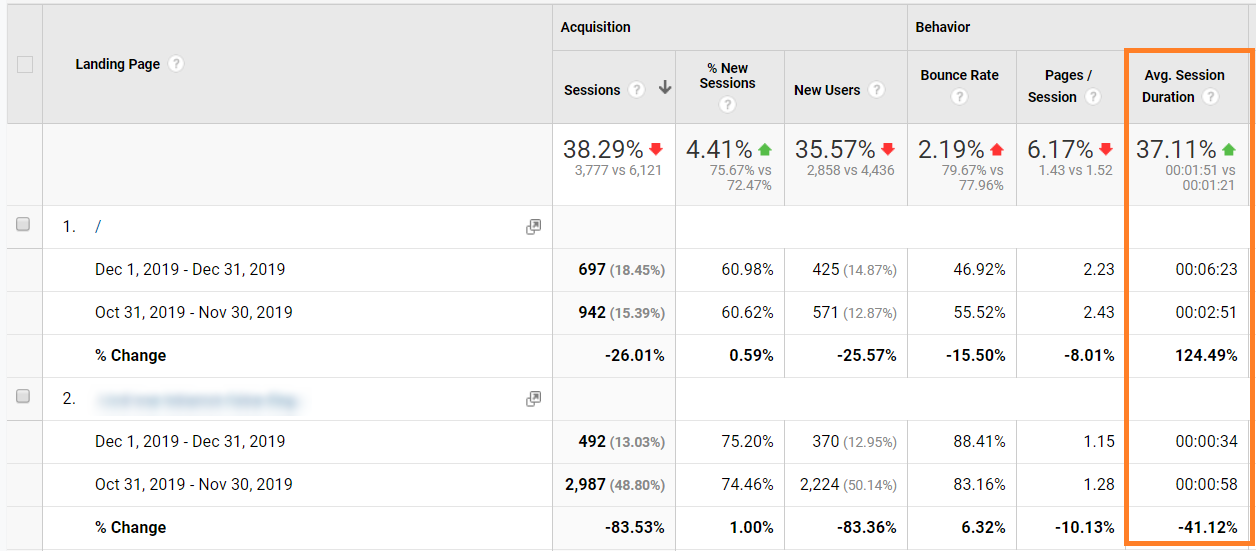
6. Average Session Duration
Average Session Duration is one of the best digital marketing metrics because it tells you how long people stay on your site. The longer, the better because that means people really like your stuff!
However, if people tend to stay on each page longer than it takes to read the copy, that could mean your site speed is too low or your website is hard to navigate.
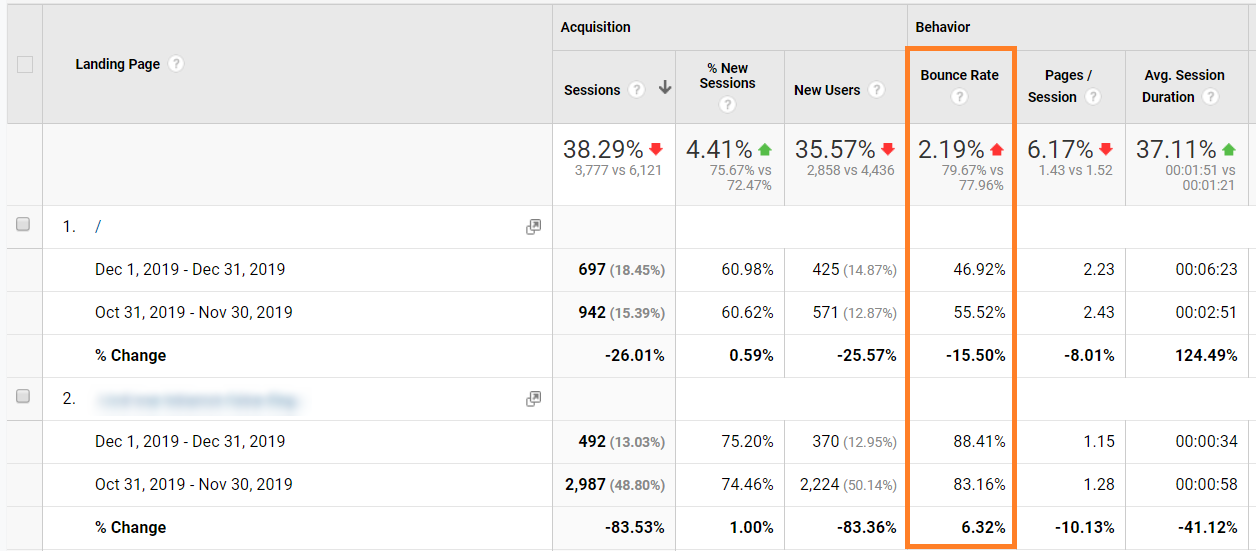
7. Bounce Rate
Bounce Rate tells you how many people viewed a single page on your site and left. Ideally, you want these digital marketing metrics as low as possible.
Let’s look at Bounce Rate from the Landing Page screen since those are some of the most important pages on your site. You can see that the homepage below has a Bounce Rate of about 50%. Not bad but the blog post rate over 80% could use some work.
Keep in mind that some of your landing pages may be designed as isolated pieces of content – bounces are the norm here after they convert or contact you. Make sure to add a thank-you page or call tracking and set clear goals for each landing page.
8. Exit Pages
Where Bounce Rate tells you how many visitors viewed a single page, Exit Rate calculates exactly where a visitor lost interest.
Right here, this figure is why it’s important to build organic traffic through SEO. People who arrive at your site from a search engine tend to stay longer than people who find your pages through social media.
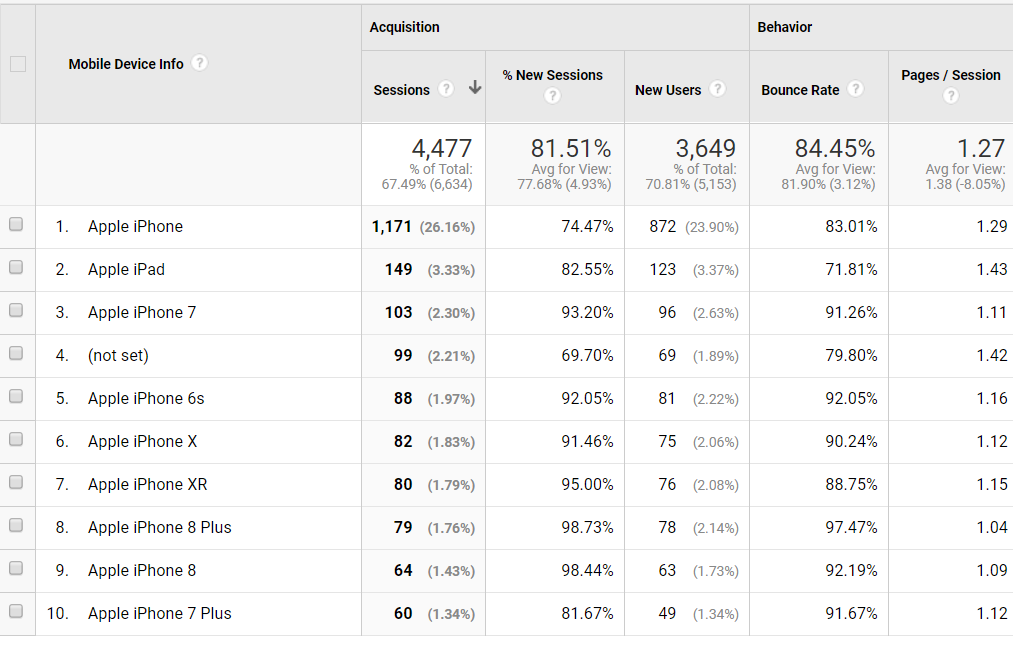
9. Devices
First, you’ll want to check out how many users are browsing your site from a mobile vs. desktop by clicking on the Mobile Overview tab.
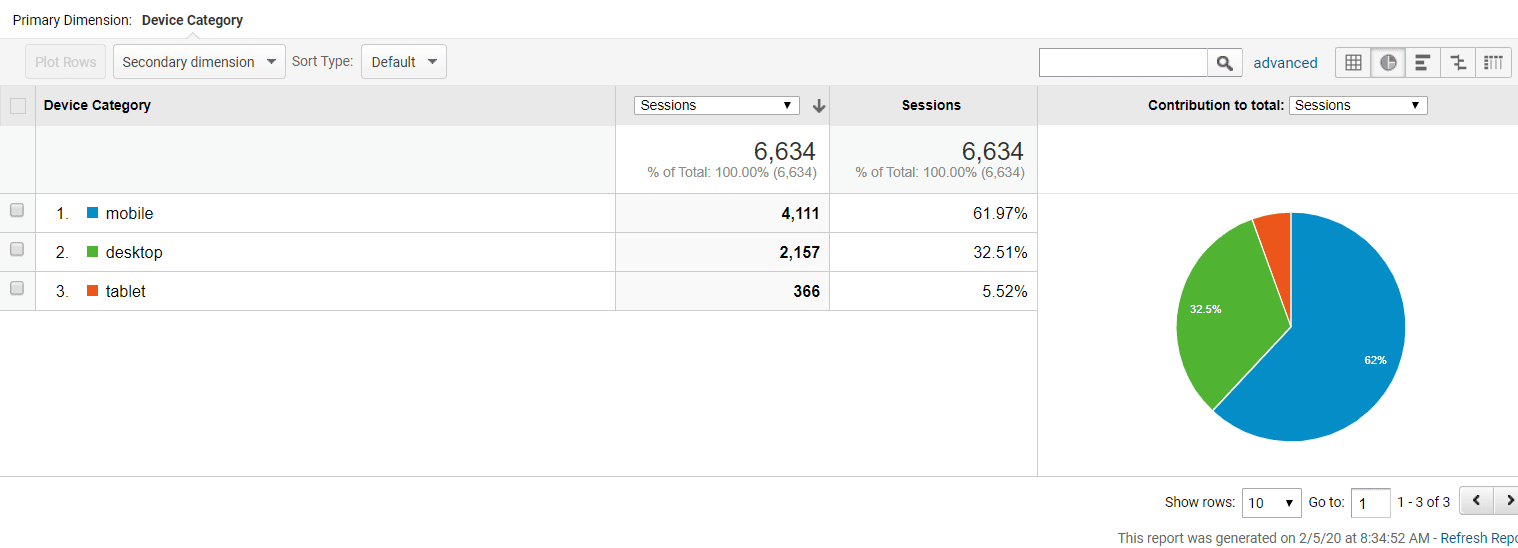
Next, you can click on Devices to get a closer look at the details:
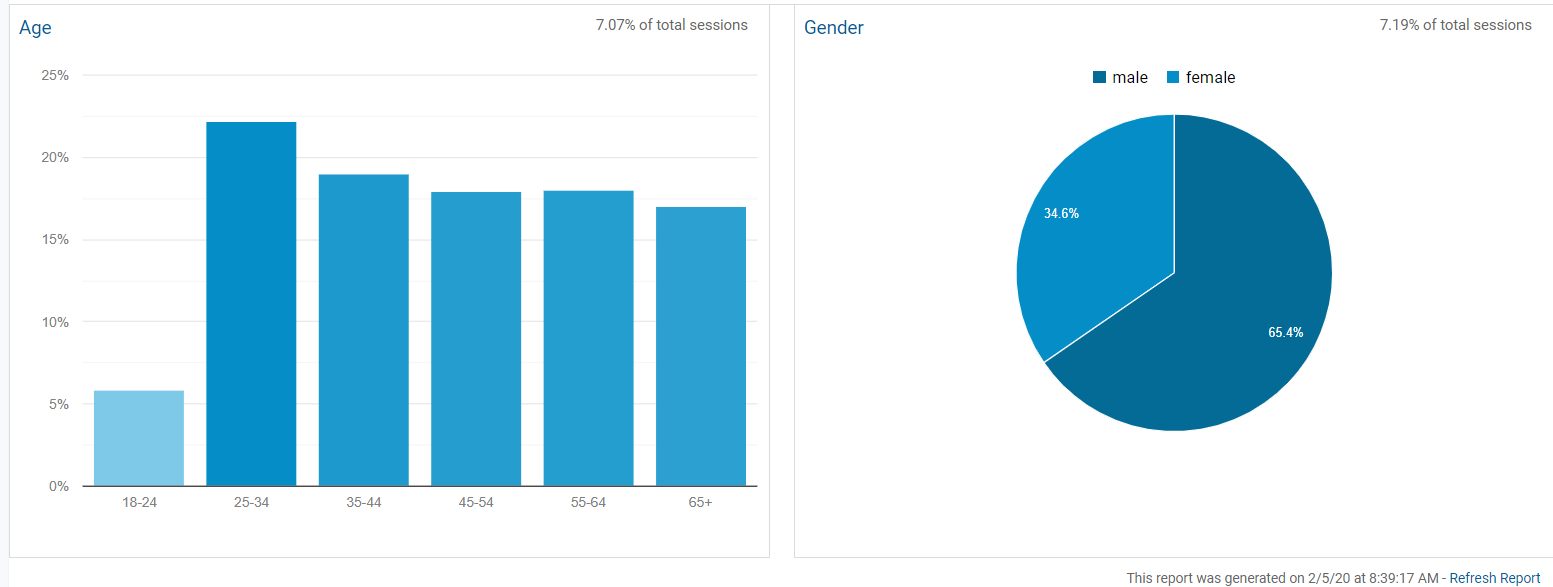
10. Demographics
By clicking on Demographics, you can glean a little insight into the general age and gender of your audience. Keep in mind that Google Analytics can only detect a fraction of your audience’s age and gender so think of this as a sample size for creating content.
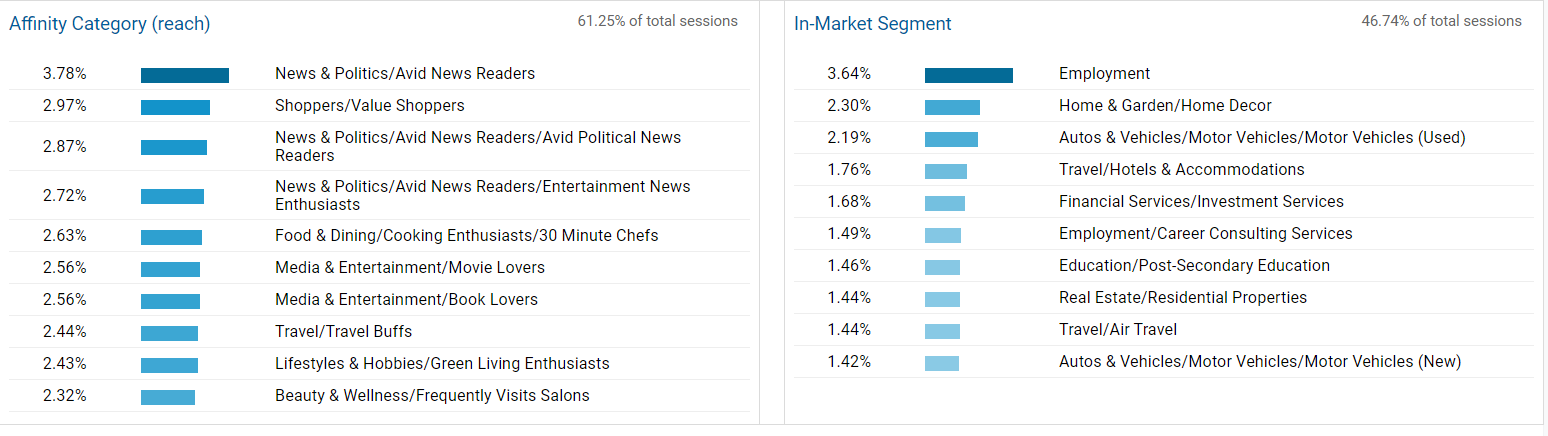
11. Interests
Here’s where it really gets fun! You can use information from the Interests tab to guide your content creation or for contacting potential advertisers and influencers.
12. Site Speed
We saved the most important for last. In the world of mobile and 5G, speed is king. Google rewards pages that load fast (best practices say less than 3 seconds) with better search engine rankings. Speed has become more critical than ever since Google switched to mobile-first indexing.
On this screen, Google Analytics will tell you how fast your site ranks on each type of device and browser so you can compare it to which browsers most of your visitors use and make changes accordingly.
A Few Tips to Maximize Your Digital Marketing Strategy
Setting some clear goals and filtering the useless traffic out can help you stay focused and ensure you’re working with the most relevant data.
Start with Clear Goals
Digital marketing metrics don’t mean anything if you don’t have anything to compare them to.
Decide on some clear goals so you can track your progress over time.
Of course, everyone wants to increase sales and conversion – but what metrics should you use to track improvement aside from actual sales?
Nail down some specific key performance indicators (KPIs) like user retention, bounce rate, and diverse acquisition sources.
Perdoo recommends creating SMART goals:

Source: Perdoo
Set a Specific Timeframe
You need something holding your feet to the fire if you want to reach your goals.
Going back to the SMART strategy, keep it realistic yet specific and time bound.
Do you want to reduce your bounce rate by 10% in 60 days? Increase your monthly retention rate by 5% in a month?
Setting a timeframe makes goals seem more realistic.
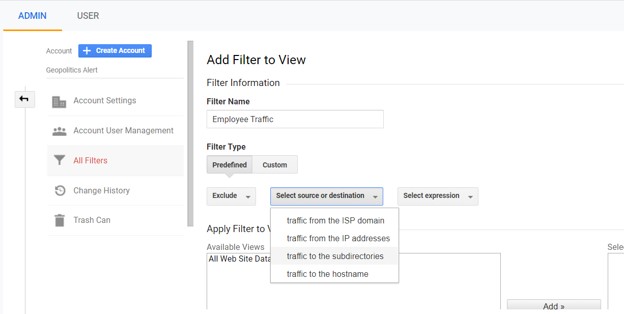
Filter Your Internal Traffic
How much of your monthly traffic comes from your own workers or contractors each month? Dozens? Hundreds?
Internal or negative traffic can seriously throw off your digital marketing metrics because it can make your goals seem unattainable.
Fortunately, Google offers a few simple solutions to filter out your internal traffic. From the Admin tab, you can choose either specific IP addresses or ISP domains to create a unique filter.
Get a Helping Hand from an Award-Winning Austin SEO Company
Award-winning SEO company JS-Interactive has over 15 years of experience helping brands and organizations in Austin improve their web design experience and SEO visibility. Both B2Bs and consumer brands trust JS-Interactive because they’re driven by customer success and committed to delivering results.
Want to talk about improving your digital marketing strategy? Book a free 30-minute call now to talk it over – no strings attached!