Web Design Statistics for 2025 & Beyond

Your website is often the first interaction a customer has with your business. That first impression happens in seconds, and design is what shapes it.
A site that loads quickly, feels intuitive, and looks polished builds trust immediately. One that’s slow or confusing can turn people away before they’ve even seen what you offer.
Design choices don’t just affect perception. They influence everything from how long visitors stay, to whether they complete a purchase to how search engines rank your content.
In 2025, user expectations are at an all-time high. A fast, mobile-friendly, and accessible design has become the new baseline.
The latest research reveals just how significant these details are.
User Experience (UX)
When people land on your site, design and usability shape their impression instantly. A seamless experience keeps them engaged, while friction points send them elsewhere.
- 94% of first impressions are design-related. Visitors form opinions about credibility in under a second. — WebFX (2024)
- 88% of online consumers won’t return after a bad experience. Poor UX permanently drives away nearly 9 out of 10 visitors. — Intechnic (2024)
- 32% of customers will abandon a brand they love after several inconsistent experiences. Even loyal customers won’t tolerate poor digital experiences. — PwC (2022)
- Every $1 invested in UX yields up to $100 in return. That’s an average ROI of 9,900%. — Forrester (2024)
- Good UX can increase conversion rates by 400%. Streamlined navigation and clear flows drive more sales and sign-ups. — Intechnic (2024)
- 70% of online businesses fail due to poor usability. Bad design—not bad products—is often the silent killer of digital ventures. — UserGuiding (2025)
Mobile & Responsive Design
Mobile traffic dominates web use today. Visitors expect phone-first experiences that work as seamlessly as desktop.
- Mobile accounts for 57.5% of global traffic. Desktop holds just 42.5%. — Statcounter (2025)
- Google now primarily ranks and indexes from the mobile version of your site. The mobile-first indexing process was fully completed in 2023, making mobile performance and usability essential for search visibility. — Google (2023)
- 90% of websites are now responsive. If yours isn’t, you’re in the minority. — Hostinger (2025)
- Mobile-friendly sites see 40% higher conversions. Smooth mobile UX pays off directly in sales. — BusinessDasher (2024)
- Users are 5× more likely to abandon a site if not mobile-optimized. — Google Ads Help (2024)
- 57% won’t recommend a business with a poor mobile site. Bad mobile UX harms reputation. — Forbes Advisor (2025)
- 84% of visitors expect mobile sites to be as good as desktop sites. No compromises. — Wonderful.io (2024)
Conversions & User Behavior
Design decisions directly impact whether visitors take action. From CTAs to checkout, small friction points can mean lost revenue.
- Average ecommerce conversion rate: 2.5–3%. Top performers exceed 10%. — Shopify (2024)
- Cart abandonment is ~70.2%. — Baymard Institute (2025)
- Average US checkout has 23+ form elements. Best practice is 12–14. — Baymard Institute (Cart Abandonment Rate, 2025)
- Video on landing pages can lift conversions by 86%. — Intechnic (2024)
- Personalized calls-to-action perform 202% better than generic ones. Tailoring CTAs to a visitor’s behavior or stage in the journey significantly increases engagement and conversions. — HubSpot (2024)
- 35% of ecommerce revenue is lost to preventable UX issues. — Baymard Institute (2025)
Page Speed & Performance
Speed isn’t just technical. It impacts rankings, conversions, and overall business revenue.
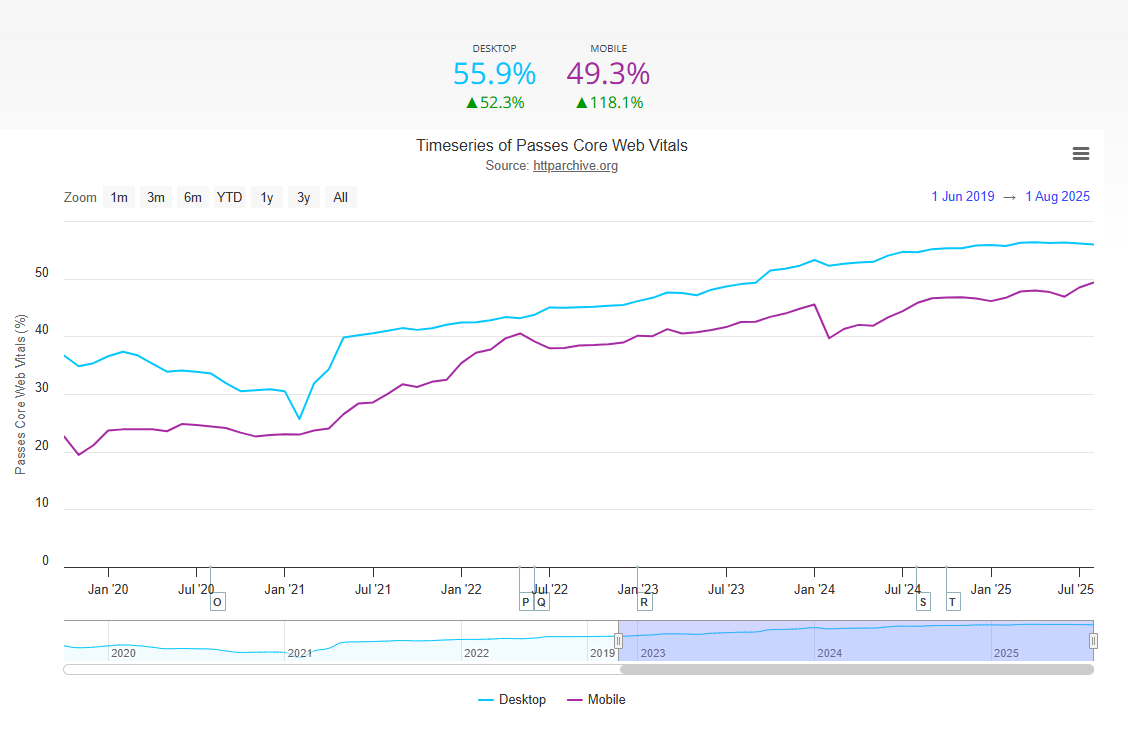
- As of August 2025, ≈ 49.3% of origins passed Core Web Vitals on mobile, and ≈ 55.9% passed on desktop. — Chrome UX Report (2025)
- Interaction to Next Paint (INP) replaced FID in March 2024. — Web.dev (INP, 2024)
- The median desktop page weight in October 2024 is 2,652 KB, while mobile is slightly lower at 2,311 KB. Pages are getting heavier each year, increasing performance challenges. — HTTP Archive (2024)
- 73% of LCP elements are images. Optimizing media is the fastest way to improve scores. — Web.dev (2024)
- The probability of a bounce increases by 32% when the page load time increases from 1 to 3 seconds. Small delays drastically impact retention, especially on mobile. — WP Rocket (2024)
- The average website load time in 2023 is 2.5 seconds on desktop and 8.6 seconds on mobile. Research shows that pages loading within 0–4 seconds achieve the highest conversion rates. — HubSpot (2023)
- Slow website performance can drain as much as 15% of a company’s annual revenue. Studies show that delays, downtime, and sluggish pages cost businesses thousands each year in lost sales and productivity. — ITPro (2024)
Accessibility & Compliance
Accessibility is both a business and legal imperative. Inclusive design helps everyone, not just people with disabilities.
- 94.8% of homepages have detectable Web Content Accessibility Guidelines (WCAG) errors. — WebAIM (2025)
- Over 4,000 ADA lawsuits were filed in 2024. — Accessibility.Works (2024)
- 1.3 billion people live with disabilities worldwide. That’s 16% of the global population. — WHO (2023)
- 71% of users with disabilities will leave inaccessible sites. — Intechnic (2024)
- Accessibility investments can improve overall usability by 30%. — Semrush (2024)
Visual Trends & Design Standards
Design trends continue to evolve, with authentic visuals, simplicity, and personalization setting the tone for 2025.
- 40% of consumers say images are the most important design factor. — Clutch (Website Redesign Checklist, 2025)
- Original graphics drive 20% more engagement than stock photos. — HubSpot (2024)
- 75% of users judge credibility by design. — Clutch (2025)
- 76.7% of marketers believe the purpose of branding is to differentiate from competitors. A unique design and consistent brand identity remain the clearest ways to stand out in crowded markets. — G2 (2025)
- 93% of designers now use AI-powered tools. — Sortlist (2025)
- 70% of users judge site quality by navigation and layout. — WebFX (2024)
Sources
- Baymard Institute (2025). Checkout UX Benchmarks. Retrieved from Baymard Institute.
- Baymard Institute (Cart Abandonment Rate, 2025). Cart Abandonment Rate Statistics. Retrieved from Baymard Institute.
- WP Rocket (2024). Website Load Time Speed Statistics: 2024 Research and Data. Retrieved from WP Rocket.
- Chrome UX Report (2025). Core Web Vitals Technology Report. Retrieved from HTTP Archive.
- Clutch (2025). Web Design Industry Survey. Retrieved from Clutch.
- BusinessDasher (2024). 25+ Web Design Statistics For Business in 2024. Retrieved from BusinessDasher.
- Google Search Central (2023). Mobile-First Indexing Has Landed. Retrieved from Google Developers.
- Hostinger (2025). Web Design Statistics. Retrieved from Hostinger.
- HTTP Archive (2024). Web Almanac: Page Weight & Media Reports. Retrieved from HTTP Archive.
- HubSpot (2024). 15 Call-to-Action Statistics You Need to Know About to Increase Your Conversion Rate. Retrieved from HubSpot.
- Forbes Advisor (2025). Website Statistics You Need to Know in 2025. Retrieved from Forbes.
- Wonderful.io (2024). Your Mobile Website May Matter More Than Your Desktop Website. Retrieved from Wonderful.io.
- Intechnic (2024). What’s a Good Average Ecommerce Conversion Rate in 2025? Retrieved from Shopify.
- Semrush (2024). Study: Is Web Accessibility the Key to Driving Organic Traffic? Retrieved from Semrush.
- PwC (2022). Creating loyalty in volatile times: PwC Customer Loyalty Survey 2022. Retrieved from PwC.
- HubSpot (2023). 11 Website Page Load Time Statistics [+ How to Increase Conversion Rate]. Retrieved from HubSpot.
- Sortlist (2025). Web Designers and AI Tools Survey. Retrieved from Sortlist.
- Statcounter (2025). Mobile vs Desktop Market Share Worldwide. Retrieved from Statcounter.
- Accessibility.Works (2024). ADA Lawsuit Trends & Statistics: 2024 Summary. Retrieved from Accessibility.Works.
- Clutch (Website Redesign Checklist, 2025). Website Redesign Checklist: What to Know Before Updating Your Site. Retrieved from Clutch.
- Web.dev (INP, 2024). Interaction to Next Paint becomes a Core Web Vital on March 12, 2024. Retrieved from Web.dev.
- Web.dev (2024). The Most Effective Ways to Improve Core Web Vitals. Retrieved from Web.dev.
- WebAIM (2025). The WebAIM Million: 2025 Report on the Accessibility of the Top 1,000,000 Home Pages. Retrieved from WebAIM.
- ITPro (2024). Slow Websites Are Costing Businesses Thousands Per Year. Retrieved from ITPro.
- World Health Organization (2023). Disability and Health – Key Facts. Retrieved from WHO.
- Google Ads Help (2024). About Mobile-Friendly Sites and Their Impact on Advertising Performance. Retrieved from Google.
- UserGuiding (2025). UX Statistics & Trends: Why User Experience Matters in 2025. Retrieved from UserGuiding.
- G2 (2025). Branding Statistics: Insights on What Shapes Strong Brands. Retrieved from G2.